Portfolio - Data Art
PulaoRead is an online reading competition initiated by the Student Government during the COVID-19 lockdown. Data from the event were analysed and visualised in a three-part data visualisation project. The visualisation is done using custom python code and NodeBox 3; the detailed visualisation process can be found in their respective blog post.
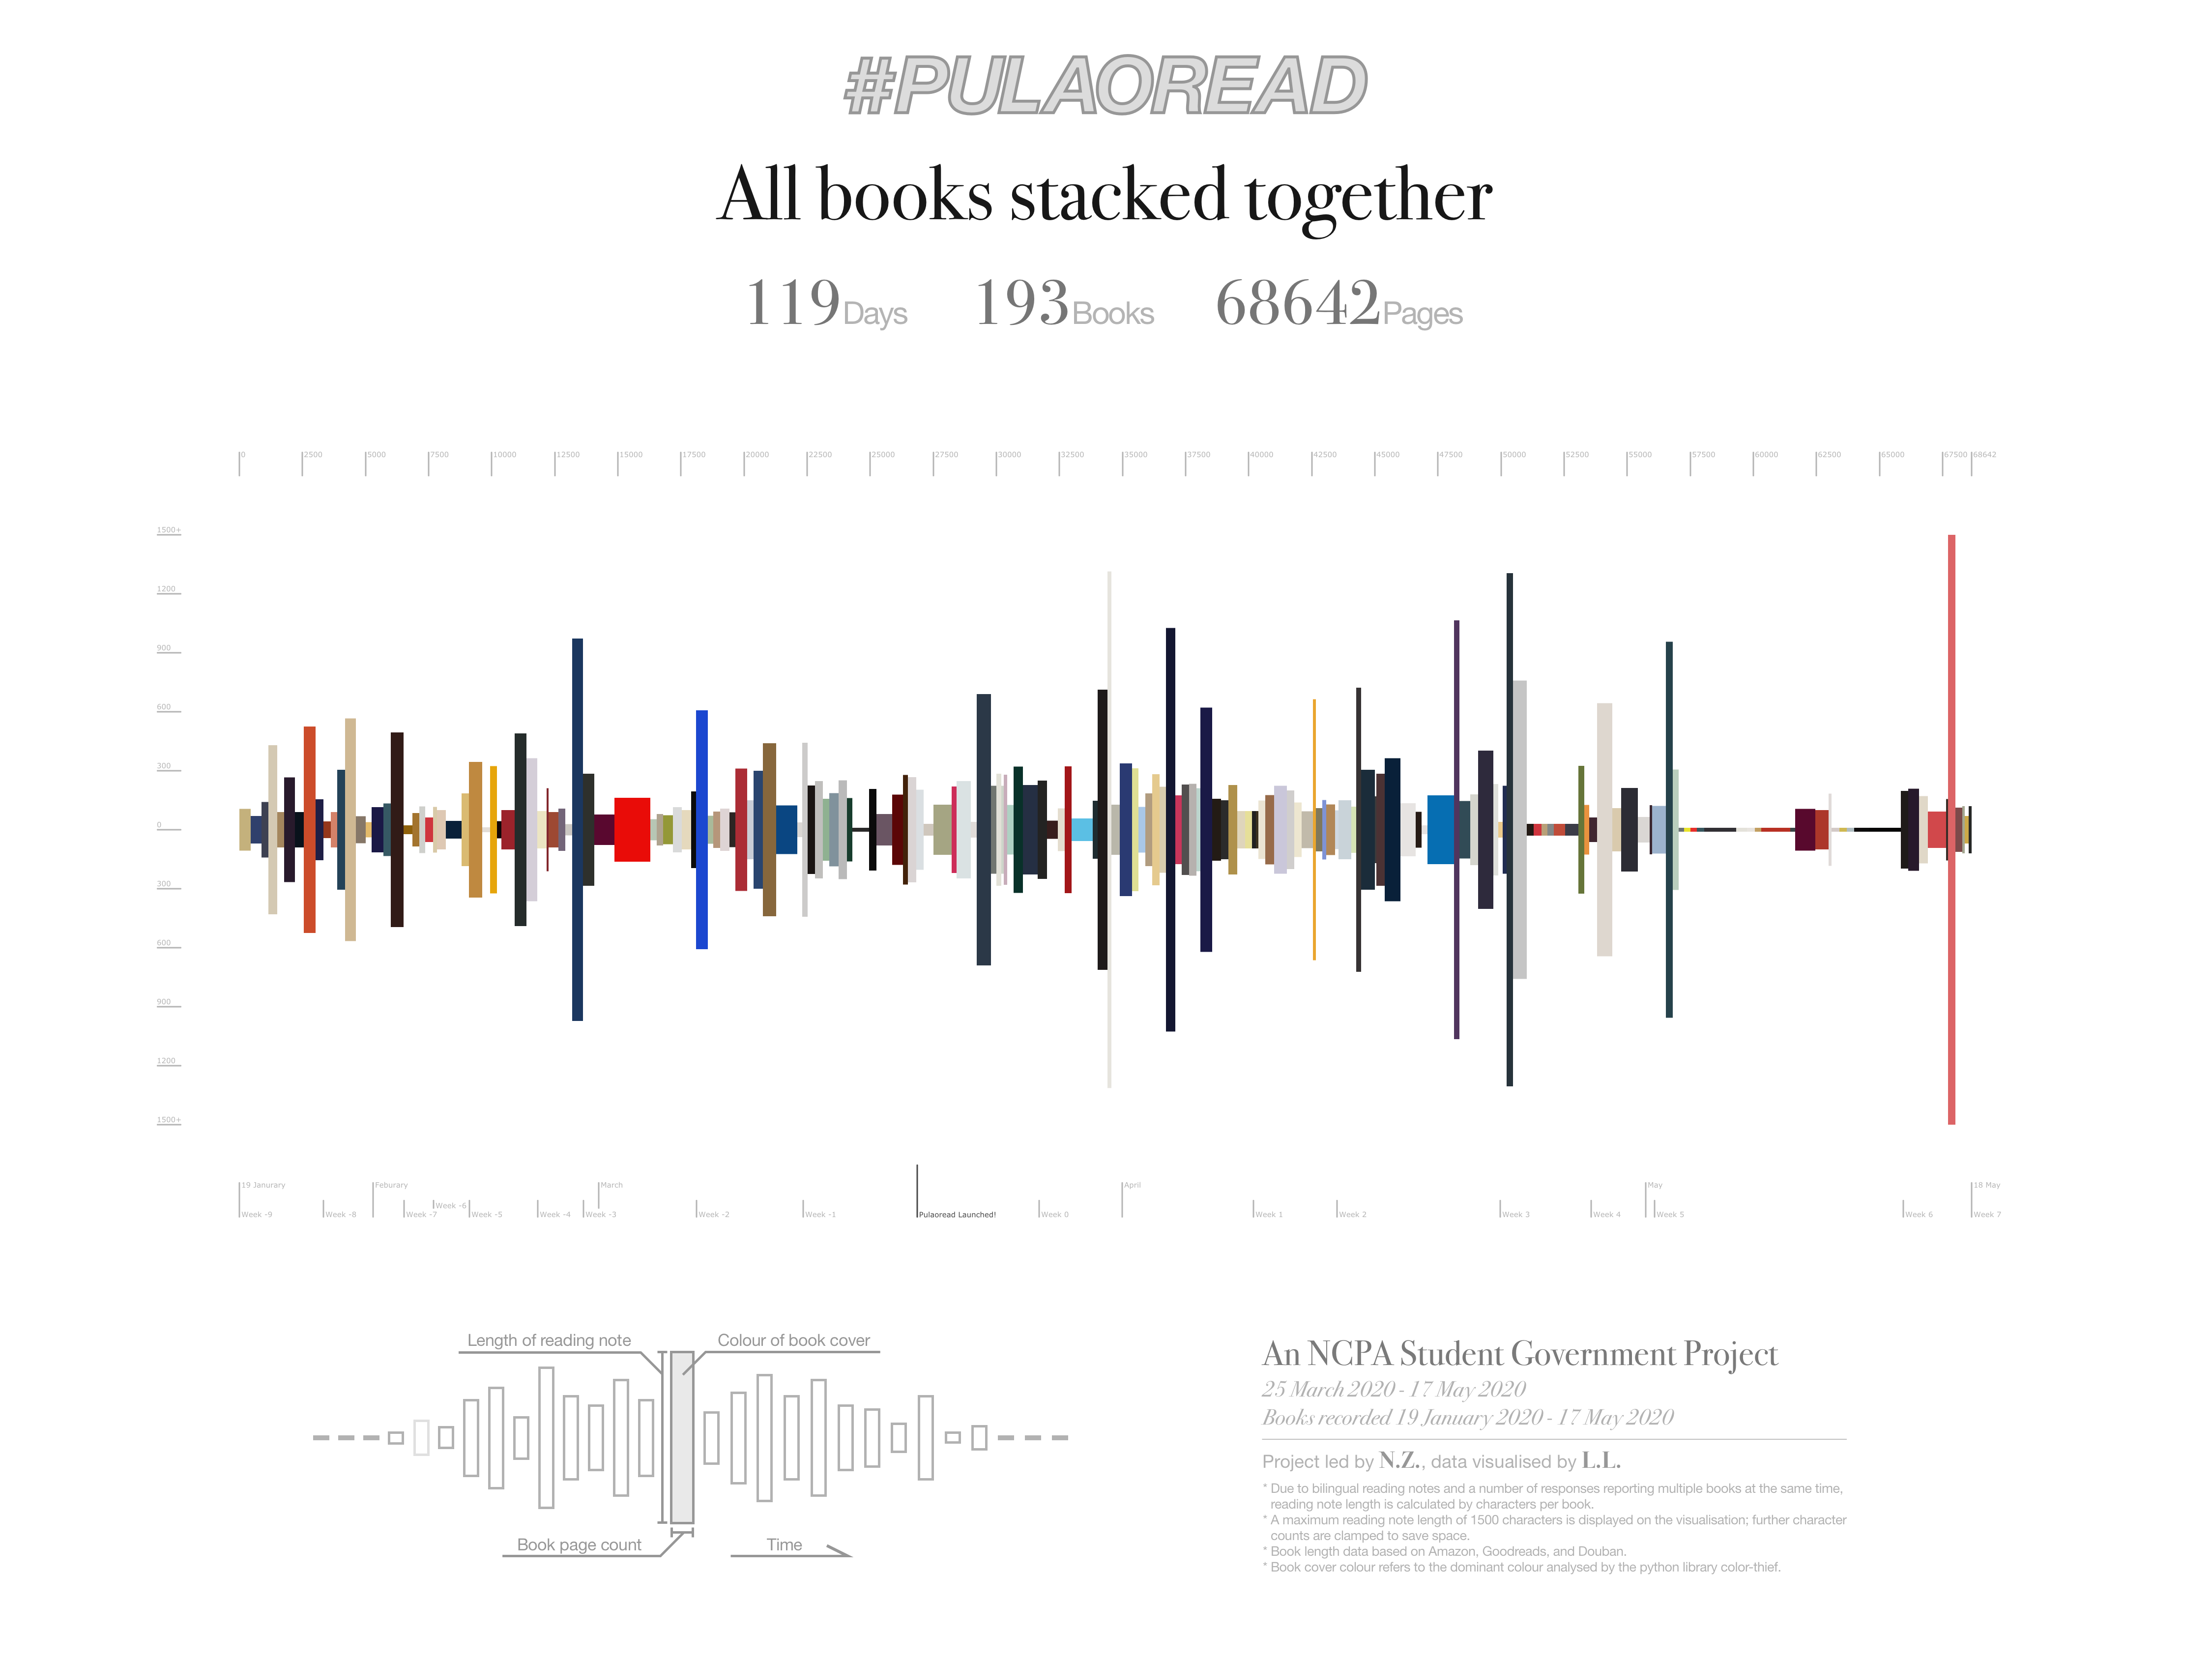
Part 1 of the project, Stacking the Books, visualises every book read for the competition in a timeline, in which the horizontal axis represents time and book length, the vertical axis represents the length of reading notes, and the colour of each rectangle represents the dominant colour of the book cover.
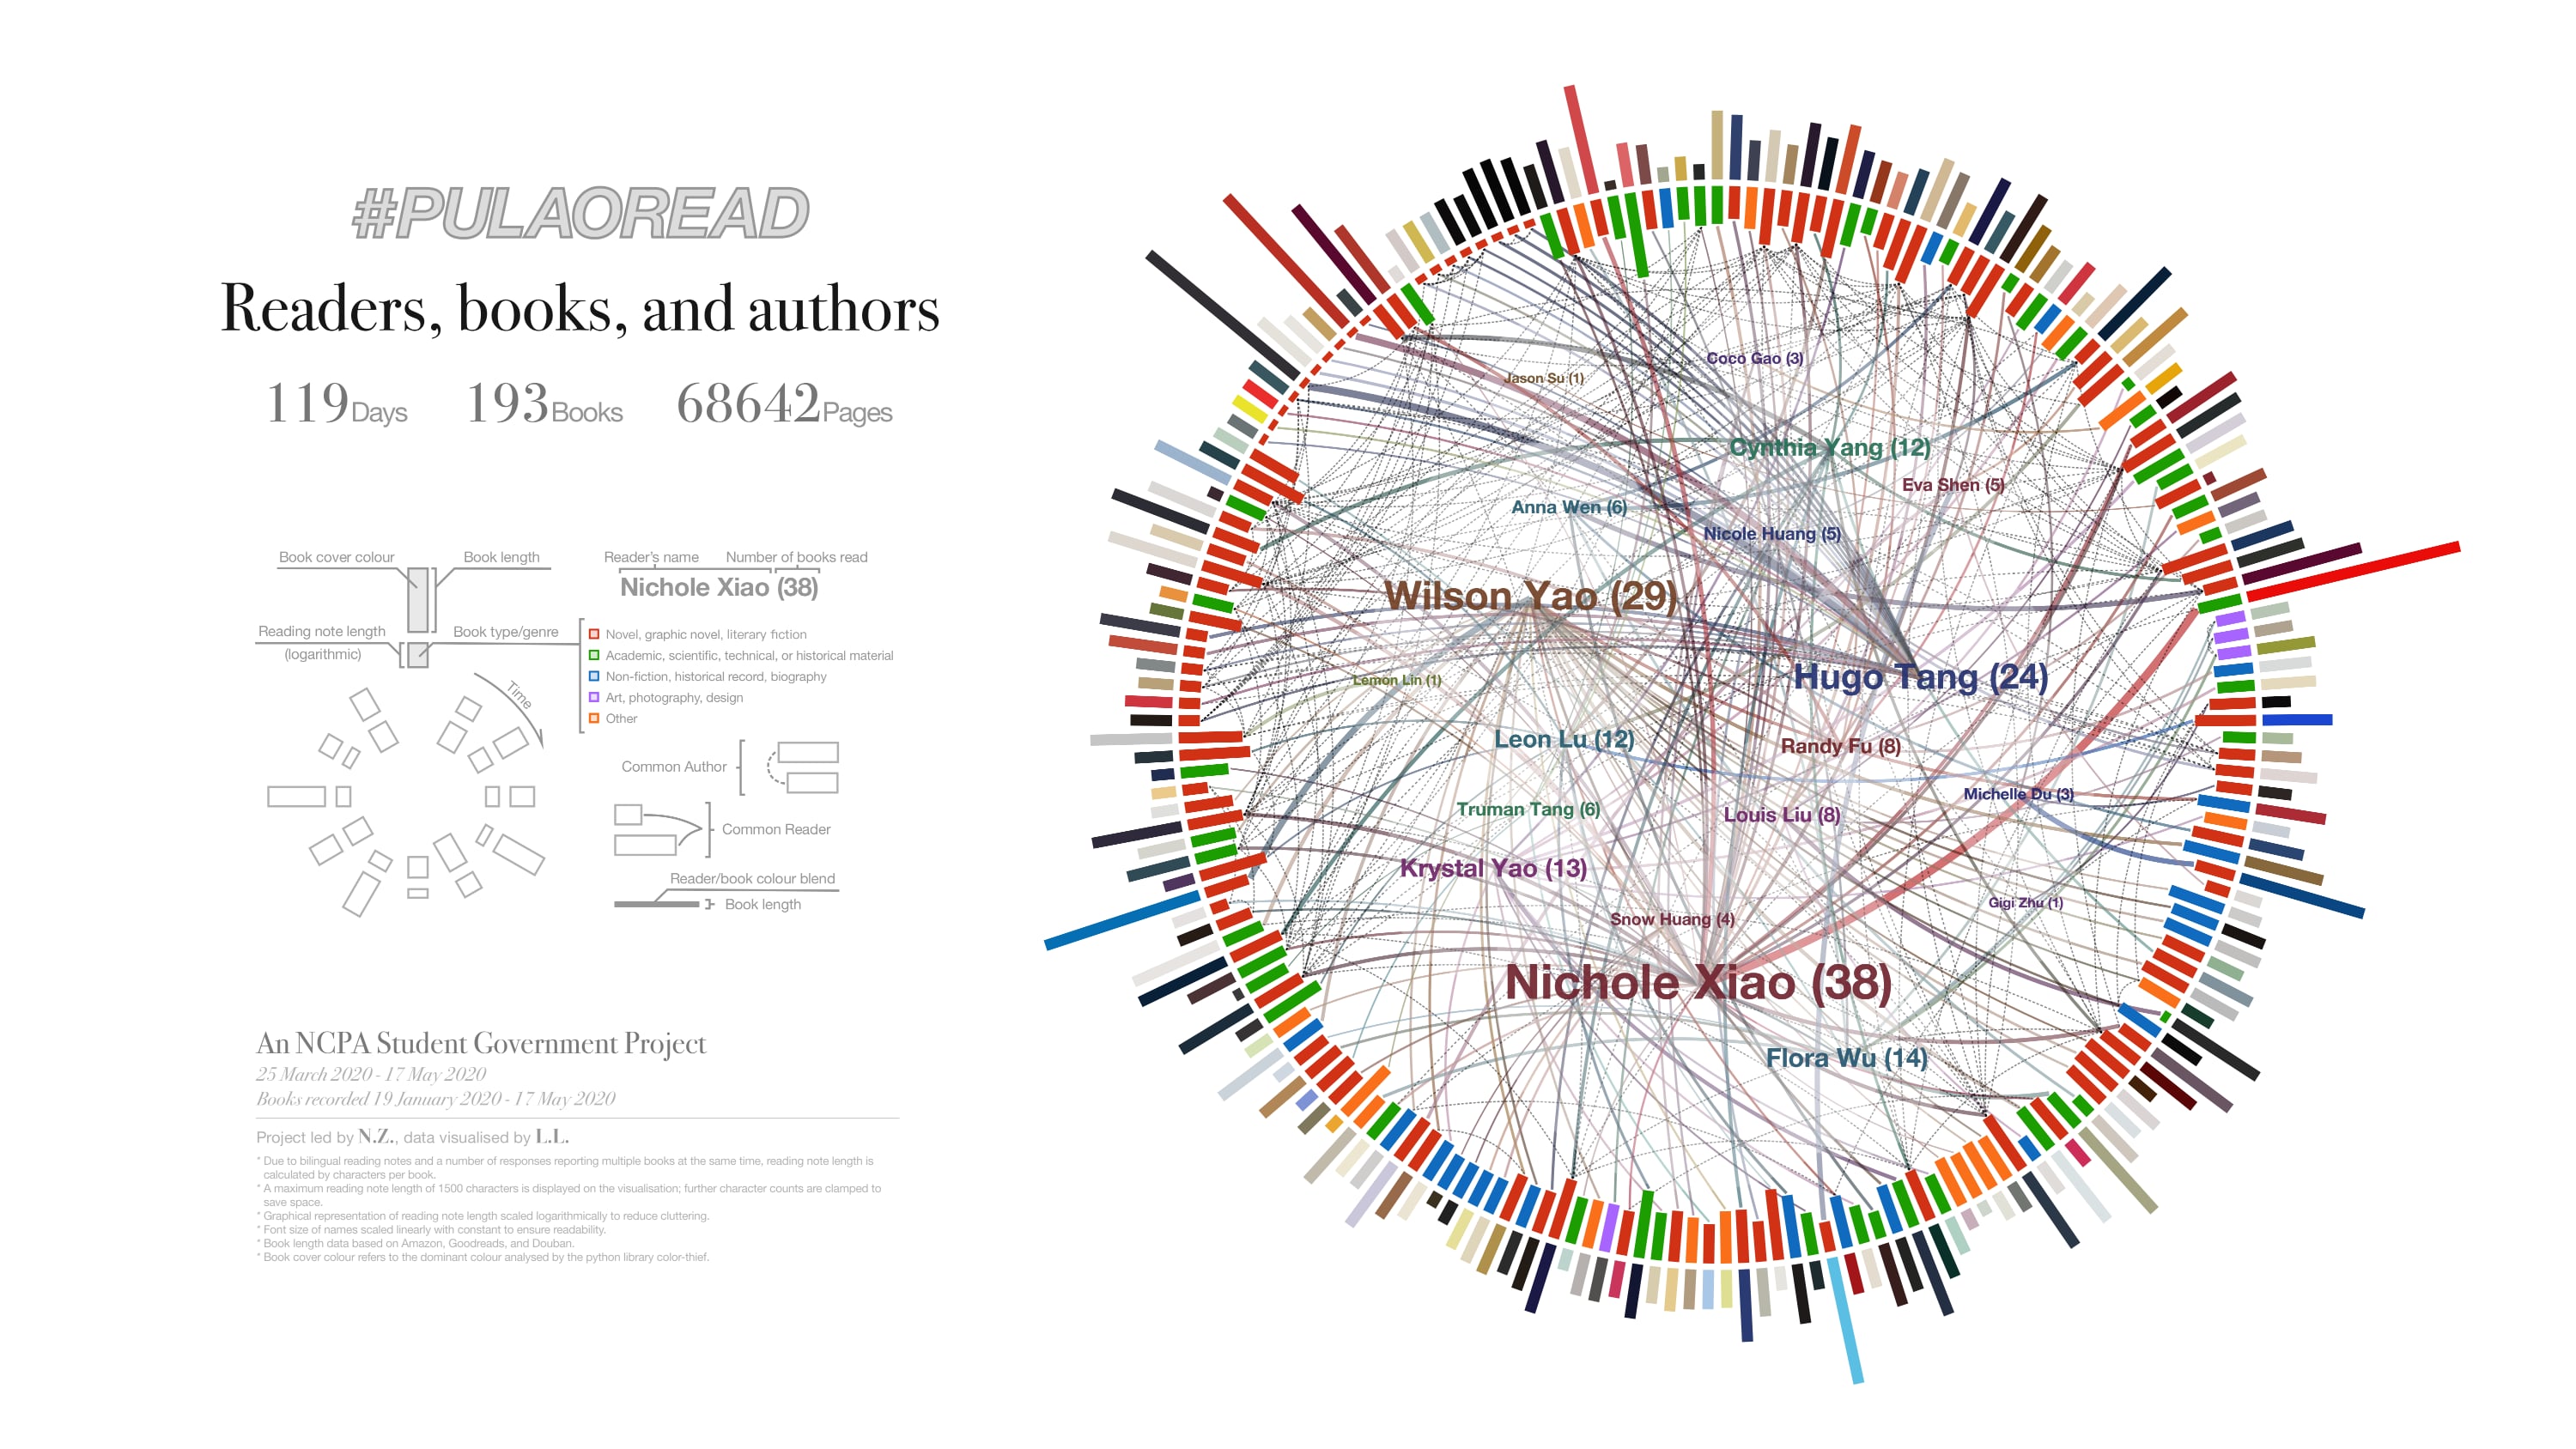
Part 2 of the project focuses on creating a network that illustrates the connections between readers, books, and authors across the competition. More information can be found in the blog post itself.
Part 3 of this project adds extra colour schemes to visualisations from previous parts.
Other parts of this Portfolio: